Brand creativity finally has a financial language.
We measure it the way media is measured — by outcomes.
Creativity has always driven more return than media measurement shows.
The problem is no one had a way to measure it — until now.
Media Mix Models and ROI Analysis might look solid, but they've not convinced CEOs and Financial Management because they don't include actual creative performance data. They're half the story only, and biased to media due to this incomplete data. ROAS looks healthy. Incrementality tests pass. But your analysis is incomplete—and it's costing you actual dollars in return calculations, credibility, legitimacy, and accuracy in your budget allocations.
Creative CPM connects creative ROI, creative effectiveness, and marketing measurement to advertising outcomes.
Creative performance has never been priced or counted in:
- Marketing Mix Modeling
- Attribution analysis
- Incrementality testing
- Budget allocation frameworks
- ROI calculations
This is a structural gap in marketing intelligence—systematically excluding detailed data on how creative performs in-market.
Creative Drives Outcomes. Sandvik Proved It.
Sandvik Global B2B Campaign
Creative Investment
Creative ROI vs. Total Cost
Outcomes Multiplier
What this means: When Sandvik measured creative performance alongside media performance, they discovered creative drove 3.95x the return of media and all associated costs combined.
One metric. Total creative return. One decision. Budget allocation clarity.
What You Can Now Do
1. Isolate Financial Return of Creative
Is creative outperforming media and production cost?
Before: Pre test, Intention, Sentiment.
After: Creative is 3.95x total cost. Improve, maintain, focus on most valuable outcomes, reduce media etc.
2. Move from Labor Based to Outcome Based
Compensation tied to outcomes.
Before: Labor based rates and agreements.
After: Outcome based fee with incented upside for targets achieved.
3. Align Your Teams on One Metric
Media + creative + finance, unified.
Before: Misaligned incentives.
After: Total ROAS. One shared outcome.
Why Creative Has Been Invisible
Media Speaks Financial
- CPM (cost per thousand)
- ROAS (return on spend)
- Efficiency metrics
Classified as an outcome.
Creative Doesn't
- Priced by:Hours, day rates, project fees
- Measured by:Indicators and sentiment
Classified as a cost.
This isn't a flaw in creative communication itself. It's a structural gap in how the industry priced and measured creative since the early 1990's.
The Paradox: 20+ Years of Proof. Zero Financial Account.
Creative drives results. The research proves it. But the research uses correlations and extrapolations—not direct financial linkage to business outcomes. So when budgets compress, CEOs treat marketing as a cost center because they can't prove creative spending directly impacts the bottom line.
IPA (2007+): Creatively awarded campaigns drive 8-11x greater effectiveness than average campaigns.
McKinsey (2017): Companies in the top quartile for creative effectiveness were 67% more likely to have above-average organic revenue growth, 70% more likely to achieve above-average shareholder returns, and 74% more likely to deliver above-average enterprise value.
Interbrand (2020): Brands with strong, distinctive brand leadership grew brand value ~50% faster than peers, even during crisis.
The Extraordinary Cost of Dull (2023): Jon Evans, Adam Morgan, System1 and Peter Field documented $189B in annual waste from dull creative—proving that underinvestment in creative quality has massive, measurable financial consequences.
McKinsey (2023): Updated analysis reiterates that creativity and design capabilities are strongly correlated with outperformance on growth and shareholder returns.
Decades of this measurement gap leads to this:
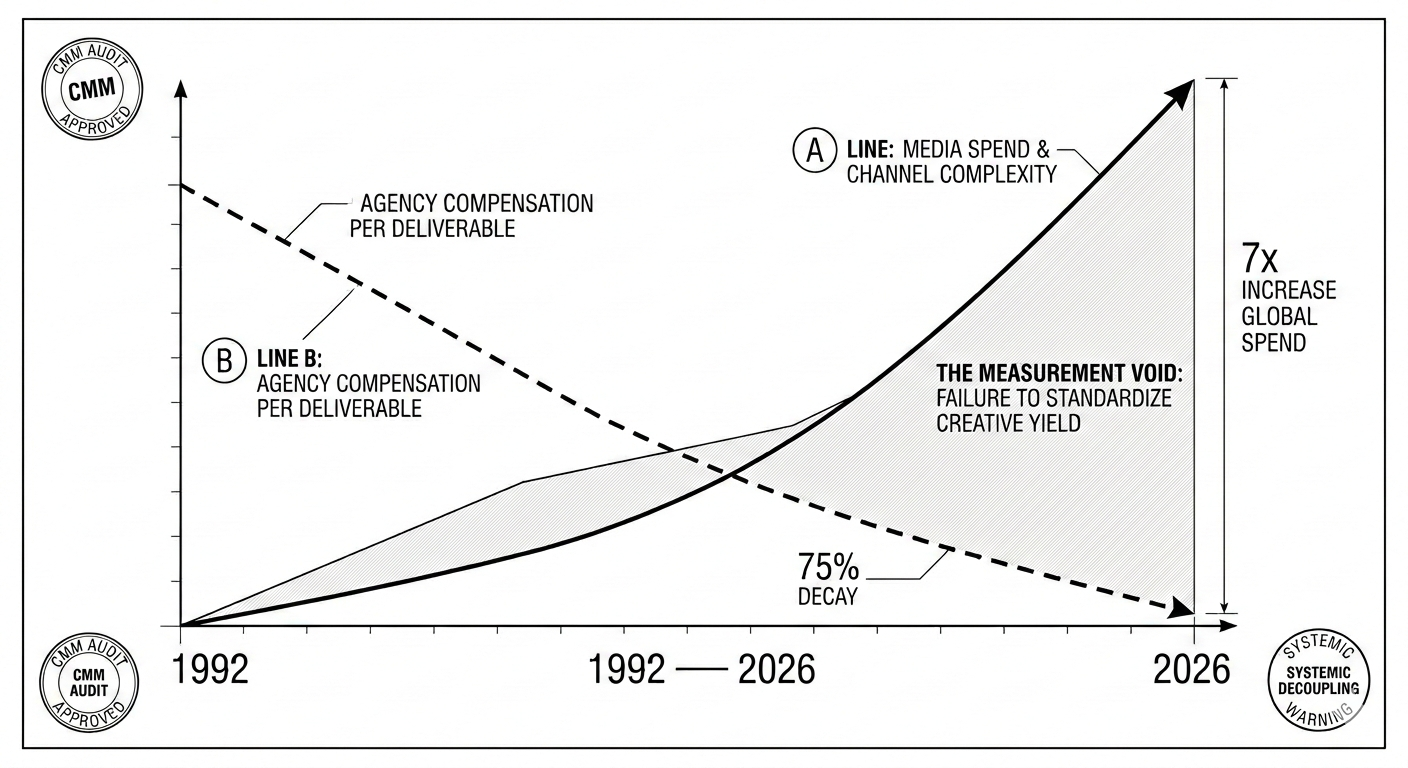
While media budgets grew 7x over 33 years, creative agency pricing fell 75% in real terms. (Michael Farmer, 2026) Companies systematically cut creative investment to chase performance efficiency.
The result: growth stalled. 30 of the top 60 US advertisers grew at only 0.7% annually—below inflation—despite shifting billions into AI and performance marketing. (Dr. Augustine Fou, 2009-2024 analysis)
And this shift is accelerating now.
60% of CEOs now view marketing as a cost center—up from just 35% a year ago.
Why? Only 13% of CEOs are very confident marketing can demonstrate financial impact, despite 79% trusting their CMO's commitment. (Boathouse CEO Study, 2026)
The disconnect isn't that creative doesn't work. It's that creative's impact has never been counted financially, and direct financial linkage was never made between weak, average, or great creative and financial performance. Just research. So when budgets compress, companies cut what they can't measure and defend.
This is why creative needs financial measurement.
To create financial language that makes creative's contribution unmistakably clear, consistently measured, and financially credible. To understand how much weak, average creative is damaging a media buy, and how much great creative is amplifying the value of that media buy. Pricing creative performance just like media allows CMOs to move marketing from a cost center to a profit and growth center, once and for all.
Your Current ROI Is Biased to Media.
Every ROI analysis you run measures performance with a critical variable missing: creative's actual financial impact.
What is happening:
If most creative in the market is consistently average or poor, as pretest data from Kantar's Link Database has confirmed for decades, then any variation in financial impact of your investment is from media performance as that is the only in-market data being counted. You attribute return variations to targeting, media mix, or timing. Creative's impact is invisible.
If creative is exceptionally strong or weak, which you might suspect but can't prove, a financial impact is indeed happening but it doesn't appear. Financial impact is moving up or down, driven by the quality and strength of the creative. But without measuring it, without an accurate account of its impact and value, you have no link between creative and that movement. Unless you isolate it and price it, you can't prove it.
This measurement gap has two critical consequences:
1. Your ROI analysis lacks validity.
You're measuring financial return without accounting for a primary variable. Your models are incomplete.
2. You can't confidently direct teams or allocate budget.
Is the creative strong but under-supported by media? Is the media efficient but creative is weak? You don't know with financial certainty. So when you allocate budget between media, creative, and production to affect total return, you're only allocating with accuracy on the media side. Creative and production investment decisions remain guesswork. You optimize what you can measure. You hope the rest works out.
Creative CPM closes this gap. It provides the mathematical financial link between creative performance and financial outcomes. For the first time, you have a complete variable set. Your ROI analysis becomes more accurate. Your financial conclusions become more valid. Your team directions become more confident.
Creative CPM isn't a replacement tool. It's the missing variable that completes your existing analysis and makes it accurate and actionable.
"We were finally able to answer the question that was killing budgets: "Does our creative actually outperform media and the total investment?" The answer was yes—4.96x for one campaign. That changed everything about how we plan, allocate and recommend."
Guy Hayward — CEO, Localheroes.marketing / Ex Global CEO, Forsman&Bodenfors / Co-Founder, 180
What Creative CPM Reveals
Creative ROI
Demonstrate creative's financial contribution to return with the same rigor as media.
Optimize Spend
Direct budget between creative and media based on multiplier performance.
Align Teams
Give creative, production, and media teams a unified financial target.
Market-Based Creative Outcome Pricing
Creative performance is priced and counted just like media, creating financial accountability and defensibility.
Data Requirements for Report
Enter manually or upload spreadsheets with your complete campaign data. Creative CPM's proprietary methodology aligns media and creative measurement—oversight and governance built into every step.
Results
Paid, Owned, Earned, Shared, Brand Tracking Increases, Sales, Site Visits, Time Spent Increases, any and all outcomes affected by the program.
Total Production Cost
Cost of concept, design, build, shoot, including agency fees and talent.
Total Paid Media
Total paid, sponsored and any bought digital or physical media cost associated with the program or campaign.
Monthly Insights
Get monthly insights on proving creative ROI, case studies, and new methodologies directly to your inbox.
Two ways to start with Creative CPM
Creative CPM measures the financial value of creative work using the same framework media already uses. Most teams start by understanding the method, then apply it themselves. There are two ways to begin—talk it through with us, or run an audit on your own.
Start with a conversation
New to this, or want to see how it applies to your work? Book a short intro call. We'll walk through the method, look at your situation, and figure out whether an audit or a wider rollout makes sense. No cost, no obligation.
Book an intro callRun an audit yourself
Already see the logic? Start with a single campaign and measure its creative financial strength. Scale from there to set benchmarks, brief against them, and move toward creative-outcome objectives—including how creative is priced and compensated.
See audit optionsAudit options
Start with one campaign and audit your creative financial strength. Then scale a range of campaigns to set benchmarks, decide how to brief and use transparent creative performance, and evolve toward creative-outcome objectives—including compensation options.
Single Report
One campaign, fully analyzed.
- Fixed-rate Creative CPM valuation
- PDF report + data breakdown
- Email support
Guided Start
One campaign + expert guidance.
- Fixed-rate Creative CPM valuation
- Data assembly consultation (30 min)
- Results interpretation call
- Priority support
Portfolio Benchmark
Five campaigns + strategy.
- 5x Creative CPM valuations
- Strategic consultation (60 min)
- Measurement roadmap
- Ongoing support
Introductory pricing while Creative CPM is in early access.
Not sure which fits? Book an intro call and we'll point you to the right one.